Pagespeed is an important factor in providing a good web user experience. A commonly quoted statistic for this is that 40% of people abandon a website that takes more than 3 seconds to load. It is common for sites to see increased conversions after implementing performance optimizations. Pagespeed is not just a factor for user experience but also effects search. Google has stated that page speed is now a factor in their web search ranking algorithm.
<aside>Visit WPO Stats to view case studies and experiments demonstrating the impact of web performance optimization (WPO) on user experience and business metrics.</aside>
There are so many factors that go into providing good pagespeed for a site, that sometimes optimizing a site seems more like art than science. Most people start with Google’s PageSpeed Insights - a tool that scores the performance of a page using several rules:
- Avoid landing page redirects
- Enable compression
- Improve server response time
- Leverage browser caching
- Minify resources
- Optimize images
- Optimize CSS Delivery
- Prioritize visible content
- Remove render-blocking JavaScript
I often tell people to take the Google PageSpeed score with “a grain of salt” because a page that seems to load slowly can have a good score while a page that seems to load fast can have a lower score. This is because the score measures how well a site is optimized for these rules and not its actual performance, and these do not necessarily correspond. Recently Google acknowledged this in a blog post announcing changes to PageSpeed Insights:
In the past, these recommendations were presented without the context of how fast the page performed in the real world, which made it hard to understand when it was appropriate to apply these optimizations. Today, we’re announcing that PageSpeed Insights will use data from the Chrome User Experience Report to make better recommendations for developers and the optimization score has been tuned to be more aligned with the real-world data.
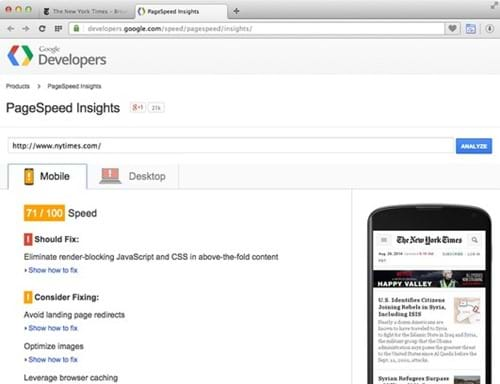
With these changes, Google PageSpeed Insights reports now distinguish between speed and optimization. The optimization score is what previously displayed, as shown in this old screenshot:

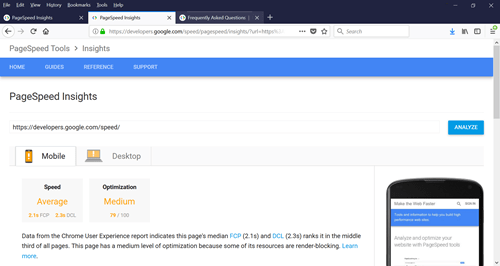
Now the reports, as shown in the following screenshot, indicates the speed of a page as fast, average or slow based on two metrics using real world data from the Chrome User Experience Report.

The metrics used are First Contentful Paint (FCP) which measures when a user first sees a visual response and DOM Content Loaded (DCL) which measures when the HTML document has been loaded and parsed. Unfortunately not all URLs have data since it comes from data collected by Chrome users. If there is not enough data, the report will say “Unavailable” and Google recommends using Lighthouse, an open-source, automated tool by Google for auditing web pages.
While it is a definite improvement that Google has included these speed metrics in PageSpeed Insights reports and it should reduce misunderstandings over what the optimization score means, I prefer WebPagetest.org’s Speed Index for a simple metric to convey the perceived performance of a web page. The documentation for Speed Index explains the problem well:
“Historically we have relied on milestone timings to determine how fast or slow web pages were. The most common of these is the time until the browser reaches the load event for the main document (onload). The load event is easy to measure both in a lab environment and in the real world. Unfortunately, it isn’t a very good indicator of the actual end-user experience. As pages grow and load a lot of content that is not visible to the user or off the screen (below the fold) the time to reach the load event is extended even if the user-visible content has long-since rendered. We have introduced more milestones over time to try to better represent the timings (time to first paint, time to DOM content ready, etc) but they are all fundamentally flawed in that they measure a single point and do not convey the actual user experience.”
To calculate the Speed Index, WebPagetest.org records a video of the page loading at 10 frames per second and measures the visual completeness at each point. The amount of incompleteness for each interval is then added up. So a page that becomes mostly visual complete quickly, will have a low score (lower is better) even if it is slow to become 100% complete. And, vice versa, a page that becomes visual complete slowly but loads completely relatively fast will have a higher (worse) score. This correlates more closely to the actual user’s experience.
There are a lot of factors that contribute to pagespeed. A variety of metrics can give us insights into the performance of a page can help us identify where optimizations can be made. While First Contentful Paint, DOM Content Loaded and Speed Index are useful metrics to track a page’s overall performance, they do not tell the whole story. Tools such as Google’s Lighthouse and WebPagetest.org help web developers analyze page speed and understand where to focus optimization efforts.